Entertainment
How hot will Earth get?

What do these events have in common?
Twenty (and counting) straight days of temperatures exceeding 110 degrees Fahrenheit in Phoenix, Arizona. 126 F measured in China. 120 F at 1 a.m. in Death Valley, California. 109 F in Rome.
They’re all new temperature records. Yes, heat waves are normal. But continuously breaking, nearly breaking, or obliterating heat records isn’t normal. Such historic and sustained heat is expected to increase in the coming years as added global warming exacerbates heat waves, and overall temperatures will continue to rise until emissions of heat-trapping greenhouse gasses drop to zero.
So, you might ask yourself: How hot will it get??
The answer is dependent on the most unpredictable part of the climate change equation: Us. More specifically, the amount of fossil fuel emissions, largely from carbon dioxide and methane, humanity loads into the atmosphere. So while a single, neat answer isn’t possible, scientists have created different heating scenarios – which are like highways to considerably different destinations – based ultimately on the choices made by prodigious carbon emitters, world governments, and beyond.
“These scenarios are so dependent on what humans are going to do – and we are not great at predicting what humans are going to do,” Flavio Lehner, a climate scientist at Cornell University who researches future warming and how it will impact Earth, told Mashable.
The good news is it’s exceedingly unlikely that we’re on the worst pathway, wherein Earth would warm by some 9 or 10 F (around 5 C) above the pre-Industrial Revolution levels of the late 19th century. But, crucially, it will also be challenging to end up with the greatest, most optimistic outcome, which would mean limiting warming to some 2.7 F (or 1.5 C) above pre-Industrial Revolution levels by this century’s end. Such an ambitious climate goal would avoid the worst consequences of Earth’s warming.
Already, Earth has warmed by 2 F (1.2 C) since the late 19th century.
How hot will Earth get?
About 10 years ago, things looked dire.
Fossil fuel use and carbon emissions were continually rising each year. It looked like Earth could be headed towards a truly catastrophic amount of warming, the worst-case scenario shown by the top maroon line in the graph below. (The graph was created by the United Nation’s Intergovernmental Panel on Climate Change – the global agency tasked with providing objective analyses of the societal impacts of climate change.) This warming scenario is called “SSP5-8.5” which essentially means extremely high greenhouse gas emissions (SSP is short for “Shared Socioeconomic Pathways”). It’s a world where, by 2100, global coal burning increases by a whopping 6.5 times. But coal use, while not declining, has largely stopped its yearly growth.
What’s more, renewable energy – the likes of wind and solar – has vastly expanded, now providing some 13 percent of energy in the U.S. (though renewables are still currently outpaced by fossil fuels both in the U.S. and globally).
“We have entered an energy transition that wasn’t apparent a decade ago,” climate scientist Zeke Hausfather told Mashable. This energy change has considerably decreased the likelihood of a worst-case climate scenario.
“What we’re doing is making the darker futures increasingly unlikely,” Hausfather said.
“What we’re doing is making the darker futures increasingly unlikely.”
On the other end of extreme scenarios is SSP1-1.9, which would limit warming to just some 2.7 F (1.5 C) above pre-Industrial Revolution levels by the century’s end. It’s the bottom, light blue line below. That’s the warming target global leaders hoped to hit when they signed the historic Paris Agreement in 2016. But it’s likely humanity will blow through this ambitious warming goal, as soon as the 2030s.
This probably leaves us in the middle ground, which still means significant warming.
“It’s not good news. But it’s also not the worst news,” Lehner, the climate scientist at Cornell University, said.

The different future warming scenarios, largely based on carbon emissions. It’s more likely we’re headed towards a middle-ground scenario, similar to the orange line, “SSP2-4.5.”
Credit: IPCC
Crucially, high warming amounts, up to perhaps some 7 F (around 4 C), are still possible and can’t be completely ruled out, Lehner said. But such warming is at the extreme edge of what’s likely, he emphasized.
So how much warming is currently realistic? Something close to the SSP2-4.5 trajectory, which is the middle orange line above, explained Hausfather. That’s in the 4.8 F (2.6 to 2.7 C) range above pre-Industrial levels.
“It’s roughly our greatest estimate from policies today,” Hausfather said, referencing the current climate policies enacted by nations. Roughly is an important caveat here, because other factors — such as how exactly Earth will respond to future CO2 levels in the atmosphere — are uncertain.
How bad will global warming be?
Some 4.8 F (2.6 C) of warming this century is still a lot. That’s a future any reasonable person would want to avoid.
“We can do a lot better,” Hausfather emphasized. “Current policies will hopefully not be the greatest we can do for the rest of the century.”
Already, just some 2 F (1.2 C) of warming has stoked momentous changes. The heating has:
Clearly, a world at some 2 F (1.2 C) is problematic, and for some, catastrophic.
“Already, we’re seeing unprecedented events,” Lehner explained. “It’s not the same climate anymore. That’s all happening at 1.2 [C].”
“Already, we’re seeing unprecedented events.”
So what happens at 3.6 F (2 C), which is around a doubling of today’s heat? “A lot of these impacts will double in frequency or severity,” Lehner said. “In a 2 degree [C] world it’s likely things are twice as bad or worse,” he added, noting that not all changes will be linear (meaning changed by the same proportion to increases in heating).
Want more science and tech news delivered straight to your inbox? Sign up for Mashable’s Light Speed newsletter today.

An IPCC graph showing the estimated annual carbon emissions for each warming pathway. (1 gigaton of carbon, or GTCO2, is 1 billion tons.)
Credit: IPCC
That’s why limiting the warming, as much as possible, is critical — not just for ourselves, but for the future residents of Earth. They will experience serious sea level rise. But, it doesn’t have to be devastating.
“Every 10th of a degree matters,” Lehner said.


Apple: pay attention to emerging markets, not falling China sales

Greatest Star Wars Day deals and new releases 2024: Shop May the 4th sales

Danti’s natural language search engine for Earth data soars with $5M in new funding

5 essential gadgets for turning your home into a self-care sanctuary

Haun Ventures is riding the bitcoin high

Hands-on with the Claude AI app: It’s pleasant to use, but janky

Calendly revamps its browser extension as it seeks to do more than schedule meetings

How to unblock porn sites: Greatest VPN for porn in 2024

Midi is building a digital platform for an oft-overlooked area of women’s health

A pro-Palestine protester hit a cop with an empty water jug. Now it’s a viral song.

NASA discovered bacteria that wouldn’t die. Now it’s boosting sunscreen.

API startup Noname Security nears $500M deal to sell itself to Akamai

US think tank Heritage Foundation hit by cyberattack

How to watch ‘Argylle’: When and where is it streaming?

Tesla drops prices, Meta confirms Llama 3 release, and Apple allows emulators in the App Store

Meta to close Threads in Turkey to comply with injunction prohibiting data-sharing with Instagram

Tesla layoffs hit high performers, some departments slashed, sources say

Former top SpaceX exec Tom Ochinero sets up new VC firm, filings reveal

TechCrunch Mobility: Cruise robotaxis return and Ford’s BlueCruise comes under scrutiny

Consumer Financial Protection Bureau fines BloomTech for false claims
Apple: pay attention to emerging markets, not falling China sales
Greatest Star Wars Day deals and new releases 2024: Shop May the 4th sales
Danti’s natural language search engine for Earth data soars with $5M in new funding
5 essential gadgets for turning your home into a self-care sanctuary
Haun Ventures is riding the bitcoin high
Hands-on with the Claude AI app: It’s pleasant to use, but janky
Calendly revamps its browser extension as it seeks to do more than schedule meetings
How to unblock porn sites: Greatest VPN for porn in 2024
Midi is building a digital platform for an oft-overlooked area of women’s health
A pro-Palestine protester hit a cop with an empty water jug. Now it’s a viral song.
-
 Entertainment6 days ago
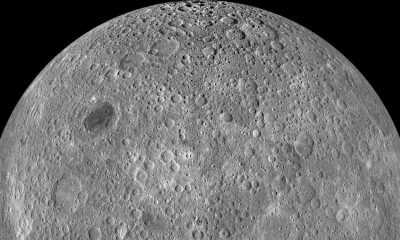
What’s on the far side of the moon? Not darkness.
-
 Business7 days ago
Thoma Bravo to take UK cybersecurity company Darktrace private in $5B deal
-
 Business7 days ago
How Rubrik’s IPO paid off big for Greylock VC Asheem Chandna
-

 Business6 days ago
TikTok faces a ban in the US, Tesla profits drop and healthcare data leaks
-
 Business5 days ago
London’s first defense tech hackathon brings Ukraine war closer to the city’s startups
-

 Business7 days ago
Photo-sharing community EyeEm will license users’ photos to train AI if they don’t delete them
-

 Entertainment6 days ago
How to watch ‘The Idea of You’: Release date, streaming deals
-

 Entertainment5 days ago
Mark Zuckerberg has found a new sense of style. Why?